Financial analysis
Reconstruct one company's economics as a summary, key metrics and a Sankey diagram of revenue to profit.
Financial analysis reconstructs one company's economics as a summary, a set of metrics and a diagram of how revenue becomes profit.
Running it
| Step | What to do |
|---|---|
| 1 | Select Research → Financial Analysis. |
| 2 | Enter a company name. Include the legal suffix and the country if the name is ambiguous. |
| 3 | Select Generate. |
What you get
| Output | Detail |
|---|---|
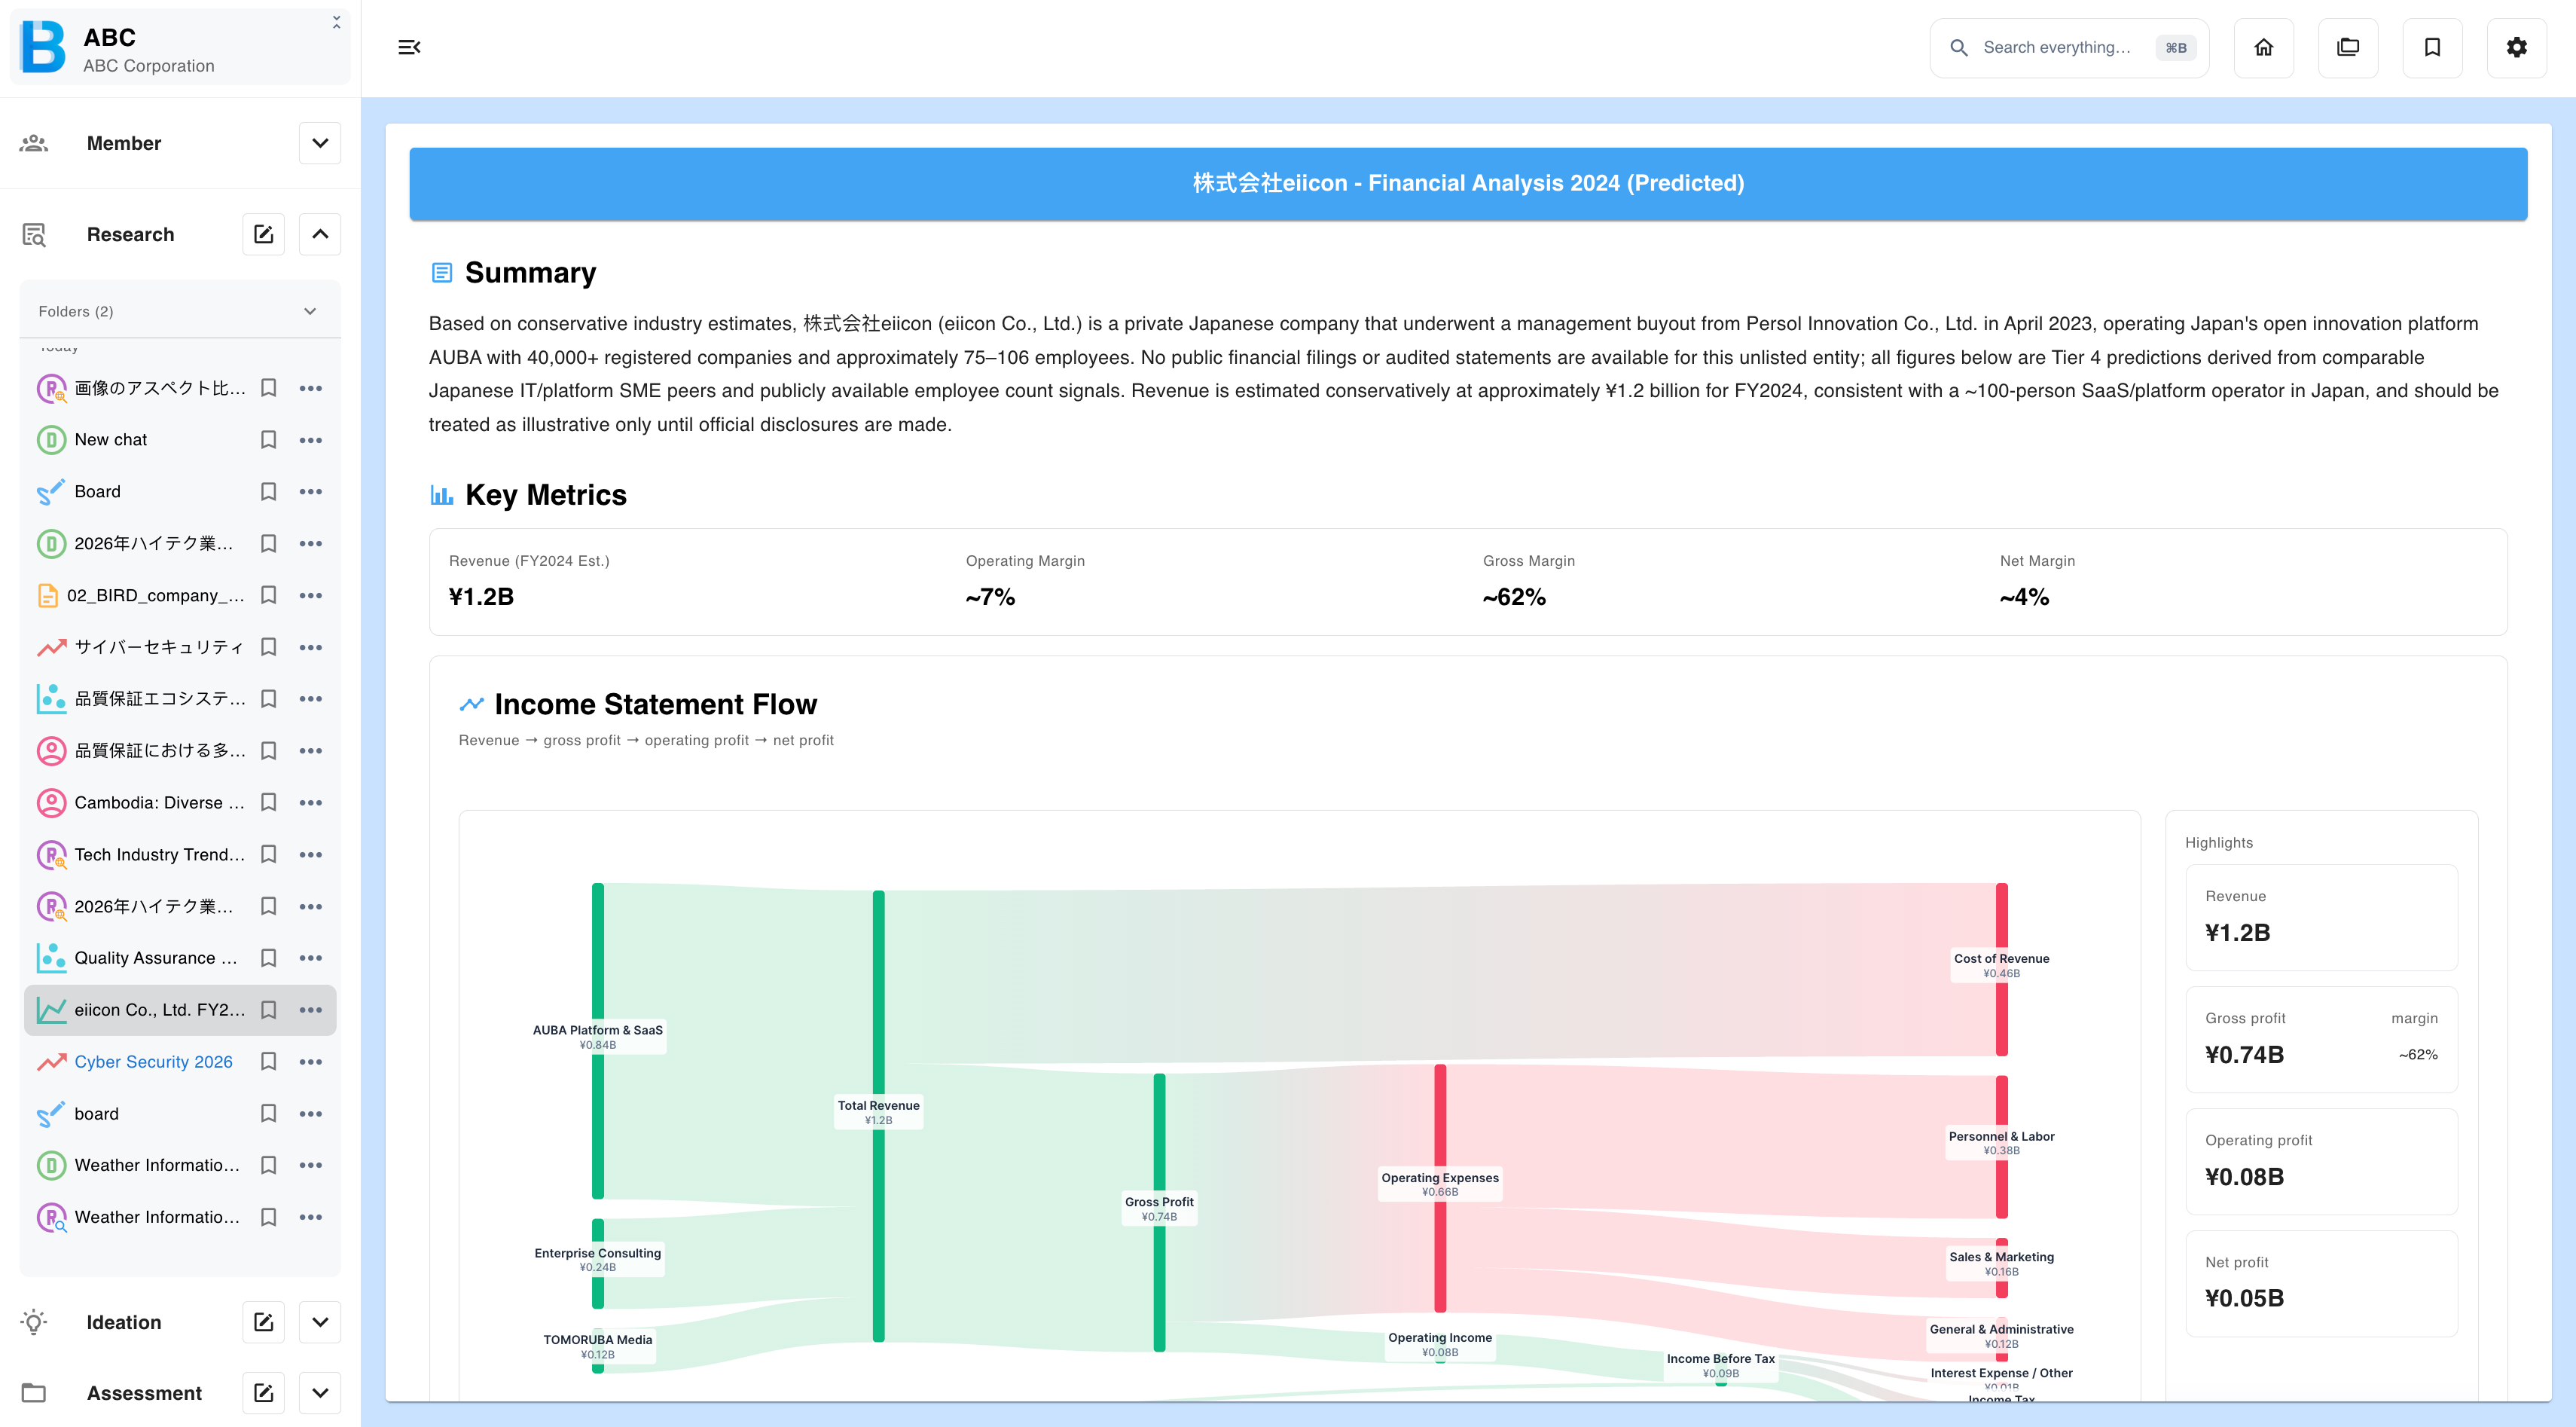
| Summary | What the estimate is based on, what the company does, and how much to trust the numbers. |
| Key metrics | Revenue, operating margin, gross margin and runway. |
| Income statement flow | A Sankey diagram running revenue → gross profit → operating profit → net profit, with each cost line sized to its share. |
| Highlights | The headline figures as cards, for copying out. |
Read the summary before the metrics. It tells you what the figures were estimated from, which decides how much weight the rest of the output can carry.