Dashboard
Your home screen: update banner, counters, quick actions, widgets, and how to rearrange the layout.
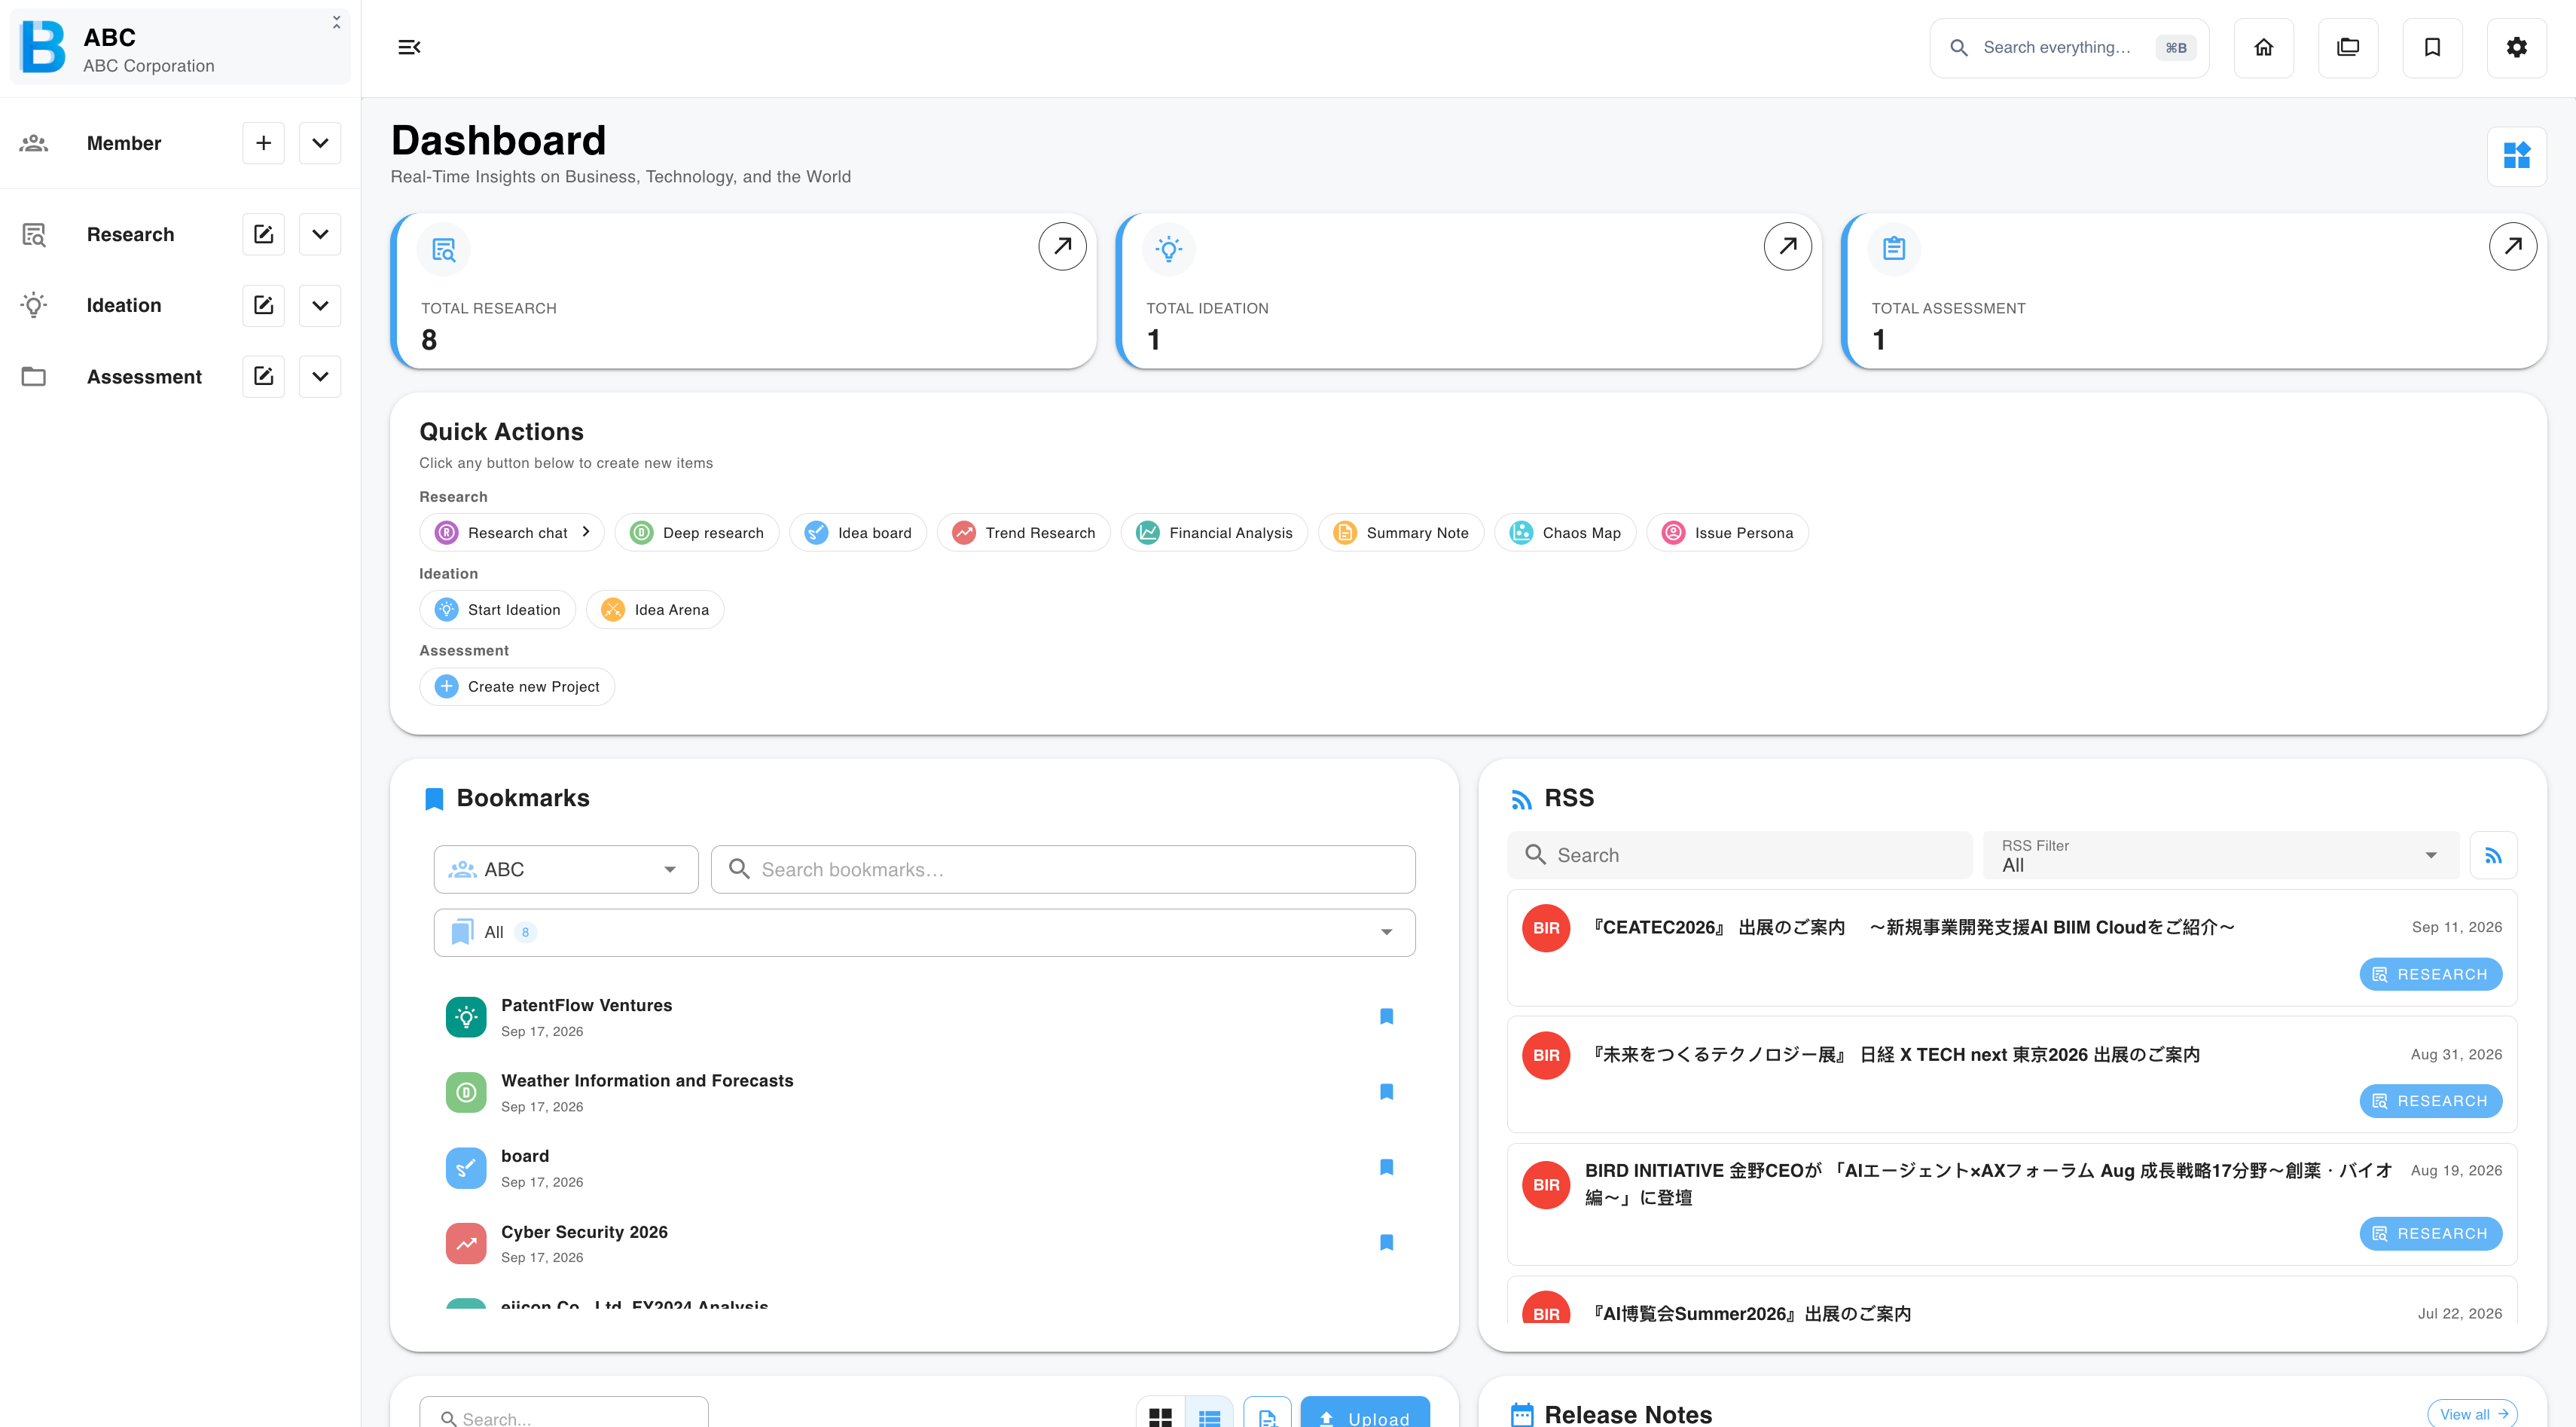
The dashboard is your home screen. It shows one group at a time — the group named in the top-left corner. Switch groups and every number and list on this page changes with it.
Update banner
The blue bar across the top lists recent changes to BIIM. Select the close cross at its right-hand end to dismiss it.
Counters
Three cards show totals for the current group: Total Research, Total Ideation and Total Assessment. Select the arrow on a card to open that section's full list.
Quick Actions
Create something new without going through the sidebar. Select any button.
| Section | Buttons |
|---|---|
| Research | Research chat · Deep research · Idea board · Trend Research · Financial Analysis · Summary Note · Chaos Map · Issue Persona |
| Ideation | Start Ideation · Idea Arena |
| Assessment | Create new Project |
Widgets
Everything below Quick Actions is a widget.
| Widget | What it shows |
|---|---|
| Bookmarks | Items you have saved. Add or remove them here — see Bookmarks. |
| File management | The group's stored files. Open or use a file without leaving the dashboard — see Files and AI Context. |
| Activity Analytics | How much has been generated over time. Choose the period from the dropdown, for example Last 8 weeks. |
| Recent Activity | A log of what every member of the group has done. Narrow it with the All Activities dropdown. |
| Release Notes | Product updates, newest first. Select View all for the full history. |
| RSS | News feeds — see RSS. |
| Country Data | One economic indicator for one country, for example Japan and Inflation. Set the Country and Indicator dropdowns. A dotted line means projected figures, not actual ones. |
| Industry, business and entrepreneurship | Reference data on industry and enterprise. Set the Dataset and Measure dropdowns, then drag the year slider. |
| Science, technology and innovation | Reference data on research and innovation, such as R&D spending. Uses the same Dataset, Measure and year controls. |
Rearranging your dashboard
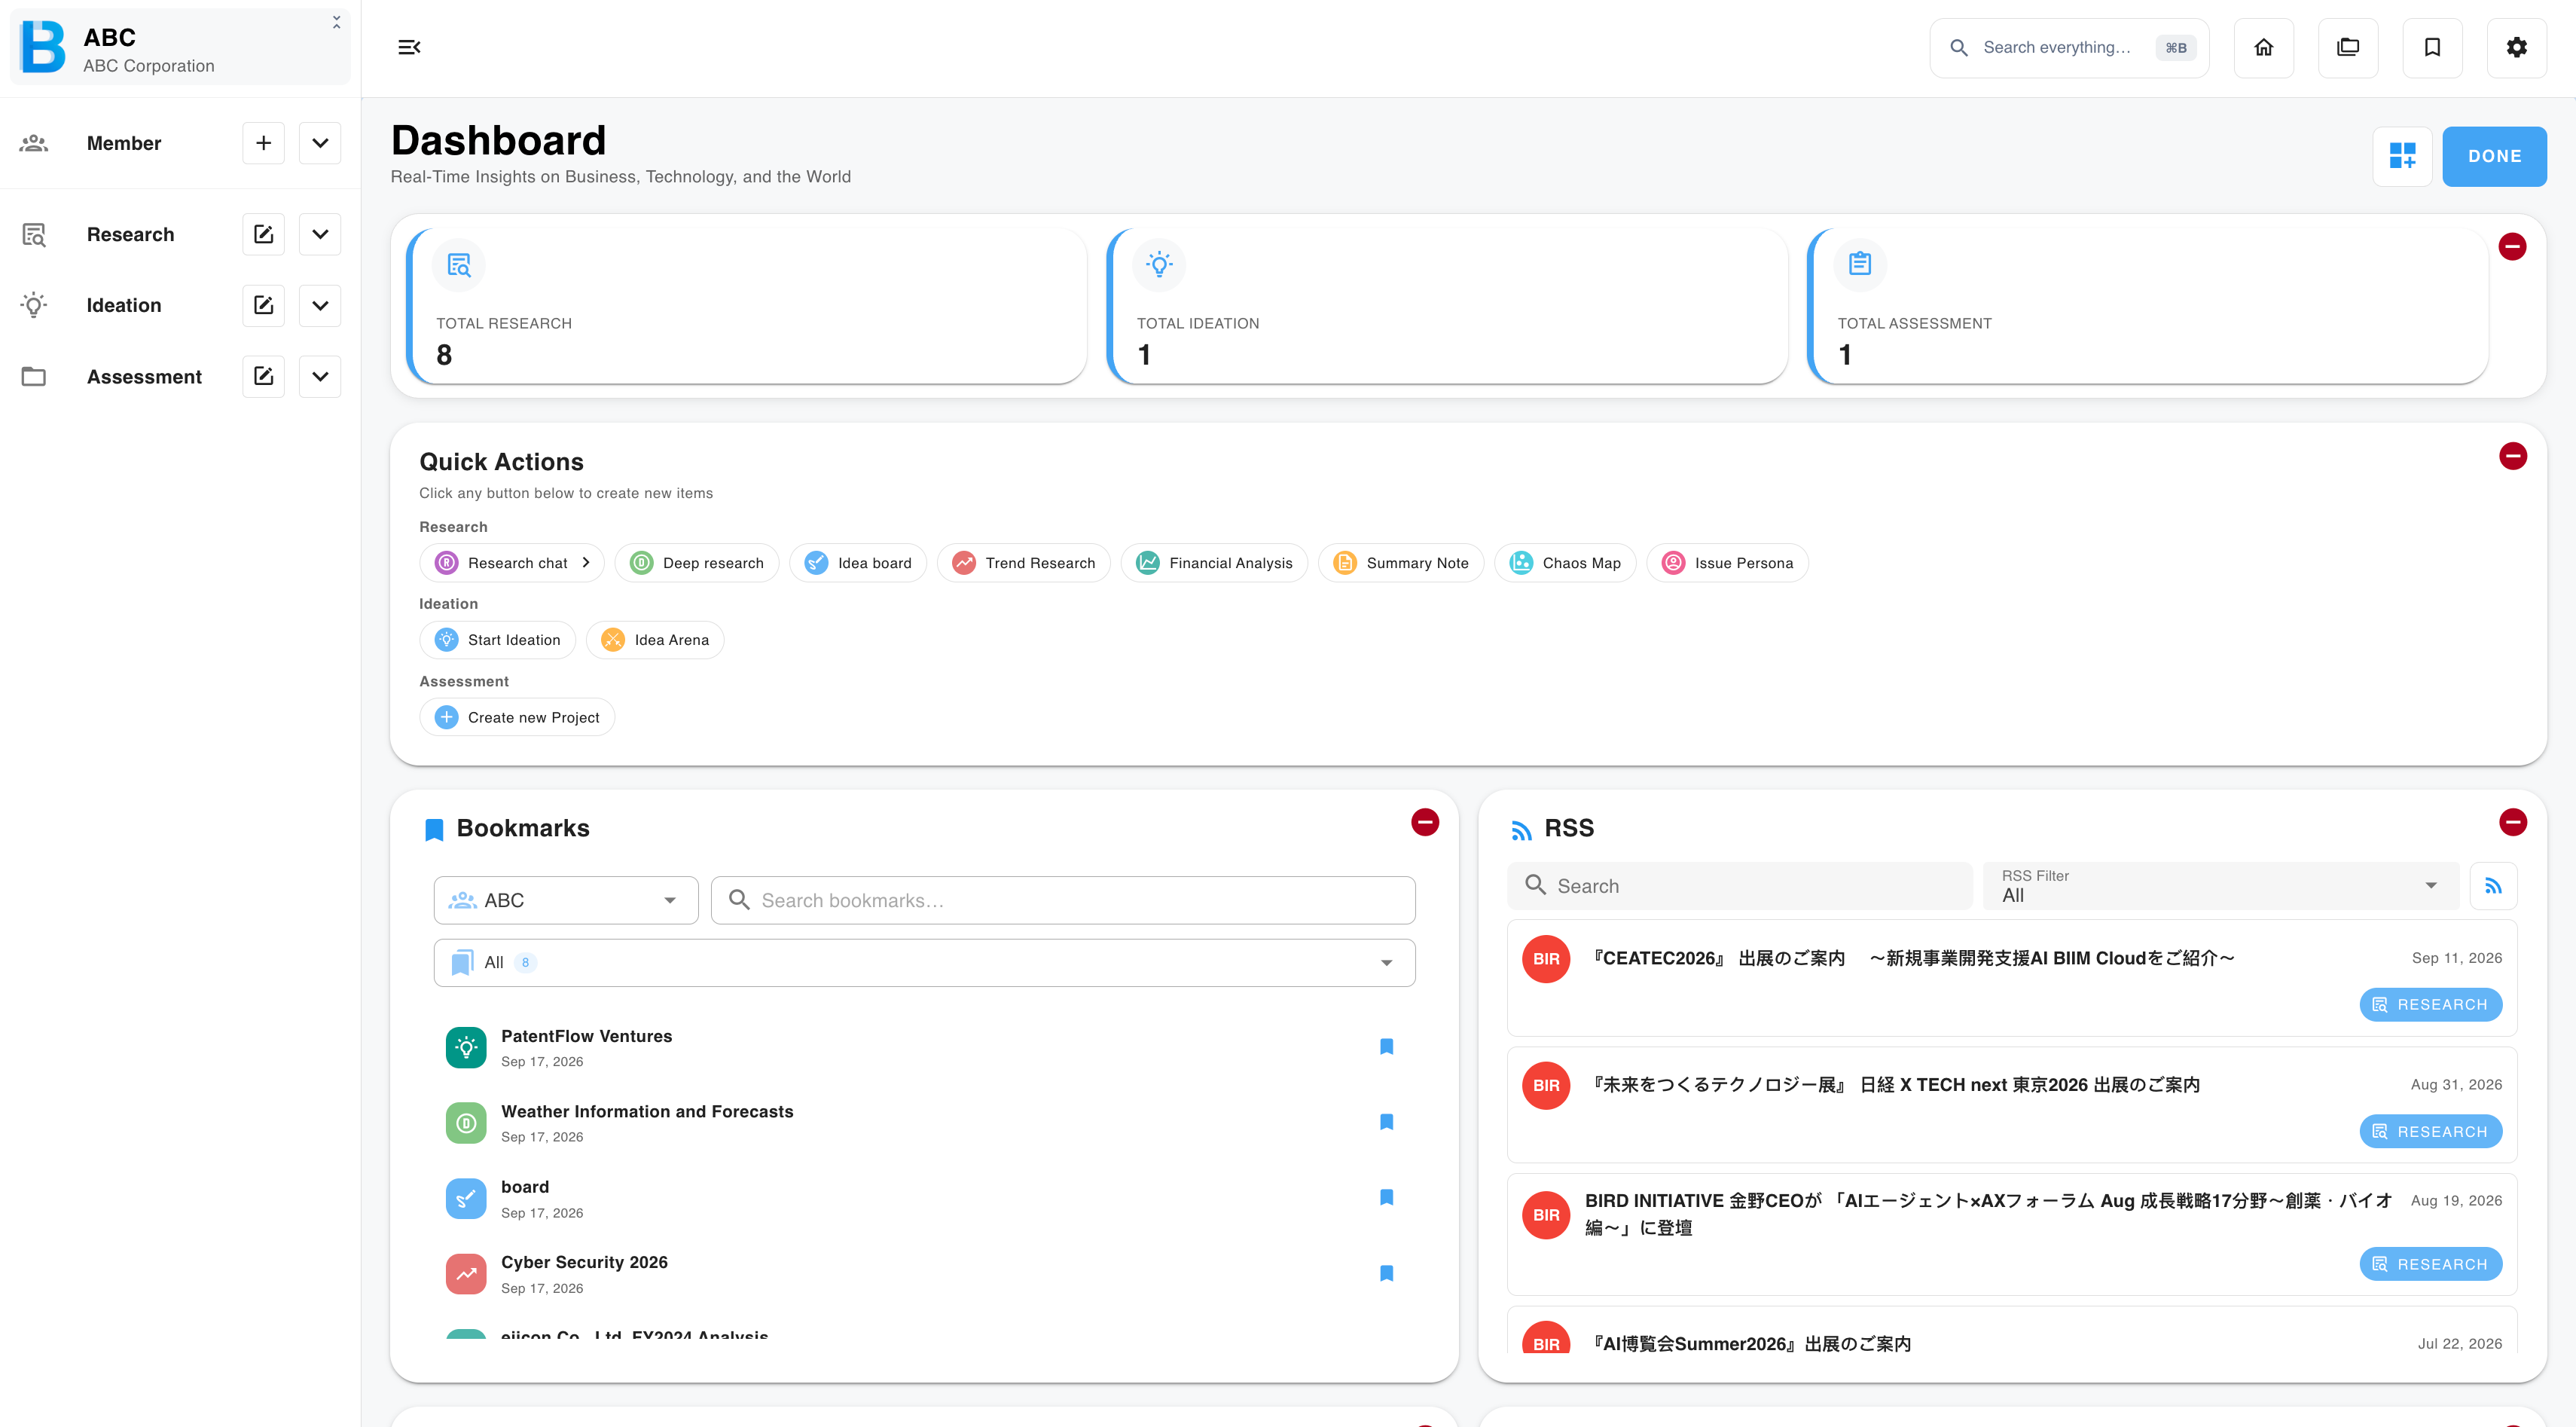
| Step | What to do |
|---|---|
| 1 | Select the widget icon in the top right. A red remove button appears on every card and the widget icon changes to Done. |
| 2 | Drag a card to a new position. Cards stay in the order you leave them. |
| 3 | Select the red remove button on a card to hide that widget. |
| 4 | Select Done to save. |
Your dashboard layout is personal. Hiding a widget or reordering the cards changes nothing for other members of the group.